08 Feb 2013
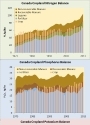
Crop N & P Balance in Ontario, 1950-2007

The crop nutrient balance on a province-wide basis provides useful information for assessing the current efficiency with which producers use nutrients, and also for assessing the impact of nutrient management regulation on the distribution of fertilizer and manure nutrients. The two figures below depict crude estimates of the historical nutrient balances for nitrogen (N) and phosphorus (P) in crop production in Ontario. Note carefully the data sources and assumptions, since these balances are imprecise estimates, and their interpretation is influenced by many assumptions.
Data Sources and Assumptions:
Manure:
• Based on OMAFRA and Statistics Canada numbers for cattle, pigs, hen, and chicken inventory.
• Calculated using coefficients per head, for available nutrients in recoverable manure (Kellogg et al., 2000).
• Assumes manure nutrient output per head increases 0.5% each year.
Fertilizer:
• Industry sales data from 1954-2002 (The Fertilizer Institute of Ontario, Canadian Fertilizer Institute, Agriculture and Agri-Food Canada).
• Sales for 1930 assumed to equal half of 1954 sales; linear growth to 1954.
Legume (fixation of N from air):
• Assumed proportional to N removed by hay, soybeans, and dry beans.
Crop Removal
• Includes nutrients removed by harvest of major crops: hay, grain and silage corn, soybean, wheat, other cereals, and potatoes.
• Based on Statistics Canada and Ontario Ministry of Agriculture and Food estimates of total production.
• Nutrient removal coefficients from the International Plant Nutrition Institute, adjusted where regional data available.
Observations
An encouraging trend in both the nitrogen and phosphorus figures is that the large surpluses seen during the 1980's are no longer evident. The differences between crop removal and amounts applied are generally smaller.
1. The increase in N inputs due to fertilizer have likely helped stabilize soil organic matter levels due to increased crop residue inputs. The current rates of nitrogen fertilization, overall, are likely not much in excess of what is necessary to maintain current levels of soil organic matter. A major uncertainty in the N figure is the input of legume N.
2. A considerable fraction of manure nitrogen excreted is considered “non-recoverable”— excreted on pasture, loafing areas, or lost from storage. A large fraction of manure nitrogen is lost to the air as ammonia, between excretion and field application.
3. From 1960 to the mid 1980’s, phosphorus supply was in surplus of crop removal. Since phosphorus is strongly retained in most soils, most of the surplus contributed to a buildup in soil fertility. The improved fertility has benefited crops. Where soils are low in phosphorus, recommendations for rate of application often exceed the removal rate. At higher soil test levels, applications that do not exceed crop removal can suffice for optimum crop yields.
4. On the other hand, because the phosphorus surplus was not distributed uniformly, soil phosphorus levels in some areas have increased to the point of risk of water contamination. Nutrient management plans deploying the Phosphorus Index manage the risk in these areas.
5. Considering that some loss of manure is inevitable, and that chemical precipitation and sorption processes in soils continue to restrict availability of soil phosphorus, current rates of fertilizer phosphorus use overall are not much in excess of what is necessary to maintain soil fertility for optimum productivity. Throughout the history of crop production in Ontario, there has always been an economic incentive to use manure nutrients efficiently. Wasted manure nutrients would increase costs in terms of increased purchases of commercial fertilizer.
Additional Resources
Calculation detailsSize: 0.31 MB