06 Mar 2014
Crop Nutrient Balance - Ontario - Phosphorus
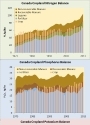
The phosphorus (P) balance shows a substantial surplus during the years when producers were building up soil fertility, up to the early 1990s. The historical surplus has contributed to the higher fertility of soils, reflected in the increased soil test P levels prevalent today. Why was such a surplus applied? The reason can be found in the chemical behavior of phosphorus in soil. Phosphorus reacts with common soil substances to form minerals. Whether applied as fertilizer or manure, a fraction is always kept away from plants by reactions with calcium, aluminum and iron. A deficient soil must usually be fertilized with considerably more than the plants remove. Over the years, the fractions that remain in the soil gradually build up, and begin to contribute a greater proportion of the plant’s needs. Eventually, phosphorus no longer needs to be added in amounts greater than plant removal. Building up the soil test is a necessary condition for efficient fertilizer use, where the amount applied doesn’t have to exceed the amount removed. In the past 20 years, crop removal has often exceeded the amount of P applied as fertilizer and recoverable manure (Figure 1). In 2011 and 2012, larger amounts of P fertilizer were applied and the balance shifted again to a small surplus. The increase in corn and soybean production has contributed to overall increase in crop removal of P (Figure 2). The P in manure is less susceptible to loss, and thus a greater fraction is recoverable, compared to N (Figure 3). The cattle industry has been in decline for several decades, but more recently the swine industry has also shrunk. These figures do not take into account the use of reduced-P feeding practices including phytase in swine diets. Hogs and poultry currently account for about half of recoverable manure P. The last few years show decreases in all sources of manure P owing to reductions in livestock and poultry. The actual decreases may be even larger owing to increasing use of diets with reduced P supplementation, and in the case of hogs, phytase. However, increasing use of dried distillers grains (DDGS) from the fuel ethanol industry may have increased levels of P in livestock diets and manures. The fate of the non-recoverable manure fraction is mostly on pastures which are not included in the crop removal figures.
Note: amounts of phosphorus are expressed as P2O5 - to convert a figure expressed as P2O5 to P, multiply by 0.43.
Figure 1. Phosphorus inputs to cropland include recoverable manure and fertilizer. Removal by harvested crops is shown by the vertical bars. The units are pounds of P2O5 per acre of total cropland. Non-recoverable manure is mainly left on pasture, and is not part of the cropland nutrient balance.
Figure 2. Phosphorus removed by harvest of major crops. Stacked areas sum to removal by the listed crops.
Figure 3. Phosphorus in manure, as-excreted and recoverable, from cattle, hogs and poultry.