30 May 2013
Crop Nutrient Response Tool
On-farm trials can be useful for validating recommendations for most economic rates of fertilizer. This tool is designed to help interpret such fertilizer rate trials.

This evaluation tool was designed to assist in interpretation and record-keeping for on-farm field crop trials involving multiple rates of any added nutrient. Its main goal is to provide the best possible estimate of "optimum rate" for a single-year response - the most economic rate (MERN) at which it is profitable to apply a purchased nutrient - from limited data. It can also estimate several basic forms of nutrient use efficiency (NUE): partial factor productivity, agronomic efficiency, partial nutrient balance, and recovery efficiency.
It can also function as a record-keeping tool. The summary worksheet provides a single-row storage for a thousand or more site-years.
For best results, trials should have at least four rates, and one of them should be zero or less than 25% of the highest rate applied. MERNs are calculated from fitted curves without assessment of statistical significance. The probability that they do not differ from zero is not calculated.
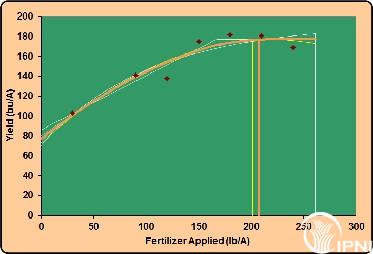
Why are five different functions fitted? The reason is that no mathematical function perfectly reflects crop response in all situations. Fitting five curves simultaneously gives the user choice as to which is most reasonable. Close agreement among the five indicates lower levels of ambiguity in the data. By taking a mean of the five curves, weighted according to their "goodness-of-fit" (R-square), the most reliable estimates of crop response are obtained.
The evaluation tool consists of a Microsoft Excel spreadsheet file with a macro that runs the Solver add-in. See Tools>Add-ins to check whether Solver add-in is installed on your computer before proceeding. A second macro is used to append all data to a summary database.
For computers without the Solver add-in, or if the "Fit" macro will not run, the response curves can be fit manually by tweaking the ABC coefficients for a good visual fit and maximum R-square. Note that cells with formulas are locked for protection.
To access the tool: download one of the Excel files on the left. The tool is available in three versions. The first is in US units (lb/A for nutrient applied, bu/A for harvested yield). The second is in metric units (kg/ha for both nutrient applied and for harvested yield). The third is a "double-version" of the tool that compares the responses from two different trials on the same chart.
Troubleshooting
When you open the Excel file, you may see a prompt similar to the following. Choose "enable macros". If the prompt differs, you may need to change macro security setting to "medium" or "low" under "Tools>Options>Security".
Adjust "View>Zoom" so that the screen looks like this:
Enter response data in any of the white cells in columns C and D (replacing the example dataset), and enter background information in purple cells.
Click "Fit", and response curves will be plotted. From them, most economic rates and efficiencies are calculated,
as shown below. The most reliable estimates are those in the column, "R2-weighted Mean." Click "Append site information to summary" to transfer the results to the Summary worksheet, if you wish to compile the results of multiple sites.
If the following error is encountered in running the "Fit" macro, the Solver library may need to be identified in Visual Basic for Applications (VBA).
Stop the macro by clicking Run>Reset, then go to Tools>References, and ensure that SOLVER is checked as an available reference. If not, you will need to browse to find SOLVER.XLA in \Microsoft Office\Office\Library\Solver. Make sure to uncheck the references marked 'MISSING:" as below.
Comments and feedback:
Tom Bruulsema, PhD, CCA
Director, Northeast Region, North America Program
International Plant Nutrition Institute
18 Maplewood Drive
Guelph, Ontario, Canada N1G 1L8
P: 519-821-5519
F: 519-821-6302
Tom.Bruulsema@ipni.net
www.ipni.net
