Regional Profile (Eastern Canada, Northeast United States)
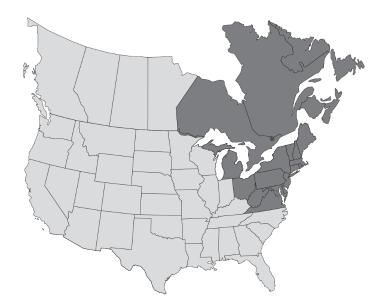
Eastern Canada – Ontario, Quebec, New Brunswick, Nova Scotia, Prince Edward Island, Newfoundland-Labrador.
Northeast United States – Michigan, Ohio, West Virginia, Virginia, Maryland, Delaware, New Jersey, Pennsylvania, New York, Connecticut, Massachusetts, Vermont, New Hampshire, Rhode Island, Maine.
General comments
The region has many areas with a large ratio of livestock to cropland area, leading to challenges of localized nutrient surpluses associated with managing manure as a source of plant nutrients. In addition to the crops listed above, there are many areas of fruit and vegetable production, both in field and in greenhouses, and both for fresh market and for processing. Potatoes comprise a substantial proportion of crop production in Prince Edward Island, New Brunswick and Maine. Population density is high; land development is taking land from agriculture and impinging upon agricultural activities. Turfgrasses for residential lawns, recreational parks and golf courses occupy a substantial area of land and vary widely in intensity of nutrient use.
| Major Crops of the Region | Eastern Canada | Northeast USA | Region Total | ||||||
2000 | 2005 | 2011 | 2000 | 2005 | 2011 | 2000 | 2005 | 2011 | |
| Area, million acres | |||||||||
| Corn* | 3.2 | 3 | 3.2 | 9.6 | 9.4 | 9.7 | 12.8 | 12.4 | 12.9 |
| Soybeans | 2.6 | 2.8 | 3.3 | 8.3 | 8.3 | 8.5 | 10.9 | 11.1 | 11.8 |
| Wheat | 0.9 | 1.2 | 1.3 | 2.5 | 2.0 | 2.3 | 3.4 | 3.2 | 3.6 |
| Forages | 5.1 | 5.1 | 5.1 | 9.6 | 9.7 | 8.8 | 14.7 | 14.8 | 13.9 |
| Yield | |||||||||
| Corn*, bu/A | 107 | 145 | 152 | 133 | 136 | 140 | 126 | 138 | 143 |
| Soybeans, bu/A | 44 | 40 | 42 | 40 | 41 | 45 | 44 | 44 | 48 |
| Wheat, bu/A | 67 | 61 | 72 | 68 | 66 | 65 | 71 | 70 | 72 |
| Forages, ton/A | 2.3 | 2.2 | 2.3 | 2.9 | 2.5 | 2.6 | 2.7 | 2.4 | 2.5 |
| Production, million tons | |||||||||
| Corn* | 9.6 | 12.2 | 13.6 | 35.7 | 35.7 | 38.2 | 45.3 | 47.9 | 51.8 |
| Soybeans | 3.4 | 3.4 | 4.2 | 10.0 | 10.3 | 11.5 | 13.4 | 13.7 | 15.7 |
| Wheat | 1.8 | 2.2 | 2.8 | 5.0 | 4.1 | 4.5 | 6.8 | 6.3 | 7.3 |
| Forages | 11.6 | 11 | 11.8 | 28.0 | 24.3 | 22.5 | 39.6 | 35.3 | 34.3 |
| Fertilizer consumption, thousand short tons | Eastern Canada | Northeast USA | Region Total | ||||||
2000 | 2005 | 2011 | 2000 | 2005 | 2010 | 2000 | 2005 | 2010 | |
| N | 316 | 313 | 384 | 1136 | 1154 | 1040 | 1452 | 1467 | 1424 |
| P2O5 | 164 | 152 | 208 | 508 | 454 | 432 | 672 | 606 | 640 |
| K2O | 227 | 216 | 209 | 783 | 765 | 709 | 1010 | 981 | 918 |